Job Market Guide, 2026
Which industries are actually hiring in 2026, according to the government's own numbers
Most "best industries to work in" lists are built on a few anecdotes and a couple of headlines about layoffs. The Bureau of Labor Statistics publishes the real numbers every month, for free: how many jobs are open, how many people actually got hired, and how many quit. Read together, they show where the real demand for workers is right now, and where the appearance of hiring is mostly churn.
The ResumeVera editorial team
Resume and hiring research, reviewed against current employer guidance.
Updated 2026-09-28T03:49:55.035Z
10 min

Section 01
Why openings, hires, and quits tell different stories
Most "best industries to work in" content is built on vibes: a few anecdotes, a couple of headlines about layoffs, and a ranking that reads the same every year regardless of what is actually happening. There is a better source, and the federal government publishes it every month for free.
The Job Openings and Labor Turnover Survey, known as JOLTS, tracks three separate things for every major industry: how many positions are open and unfilled, how many people got hired, and how many people quit voluntarily. Each of those numbers means something different, and reading them together tells you more than any one of them alone.
A high openings rate means employers have more unfilled positions relative to their total employment. On its own that can mean real, unmet demand for workers, or it can mean the employer is being unusually picky, or both. A high hires rate means people are actually moving into jobs in that sector right now, which is a more direct signal of active hiring than a posted vacancy is. A high quits rate means workers are leaving voluntarily at an elevated pace, which can be a sign of bad conditions, or a sign that workers in that sector currently have enough leverage to leave for something better, or, in high-turnover service work, simply a normal feature of how the sector runs.
None of the three numbers is good or bad by itself. The combination is what tells you something.
Section 02
The sector by sector numbers, July 2026
Here is where things stood in July 2026, the most recent month available, seasonally adjusted, across every major industry the survey covers. Rates are openings, hires, or quits as a percentage of that industry's total employment, so they are comparable across industries of very different sizes.
| Industry | Openings rate | Hires rate | Quits rate |
|---|---|---|---|
| Total nonfarm | 4.4% | 3.2% | 1.9% |
| Private education and health services | 5.3% | 2.8% | 1.8% |
| Professional and business services | 4.8% | 4.0% | 1.8% |
| Other services | 4.6% | 4.0% | 2.2% |
| Manufacturing | 4.4% | 2.3% | 1.4% |
| Leisure and hospitality | 4.4% | 5.2% | 3.4% |
| Trade, transportation, and utilities | 4.2% | 3.7% | 2.6% |
| Financial activities | 4.2% | 1.6% | 1.2% |
| Government | 3.4% | 1.3% | 0.8% |
| Construction | 3.8% | 4.4% | 1.9% |
| Mining and logging | 3.5% | 4.0% | 2.6% |
| Information | 3.3% | 2.4% | 1.0% |
Sorted by openings rate, the picture that emerges is not the one most career advice assumes. The sector with the single largest share of unfilled jobs relative to its size is not technology or finance. It is private education and health services, and by a meaningful margin.
Section 03
A year of cooling in some places, tightening in others
A single month is a snapshot. Comparing July 2026 with July 2025 shows which of these patterns are new and which have been building for a while.
| Industry | Openings rate, Jul 2025 | Openings rate, Jul 2026 | Change |
|---|---|---|---|
| Information | 6.4% | 3.3% | -3.1 pts |
| Leisure and hospitality | 5.5% | 4.4% | -1.1 pts |
| Professional and business services | 5.5% | 4.8% | -0.7 pts |
| Manufacturing | 3.3% | 4.4% | +1.1 pts |
| Private education and health services | 4.8% | 5.3% | +0.5 pts |
| Trade, transportation, and utilities | 3.6% | 4.2% | +0.6 pts |
| Government | 3.2% | 3.4% | +0.2 pts |
The sharpest move in either direction belongs to information, the sector covering publishing, telecommunications, and much of the software industry. Its openings rate fell from 6.4 percent to 3.3 percent over the year, the steepest pullback of any industry tracked, and its hires rate fell alongside it. A year ago this was the tightest sector in the entire table. It no longer is.
Leisure and hospitality and professional and business services both cooled as well, though less dramatically, which lines up with the deceleration already visible in this month's hires figures for professional services. Meanwhile private education and health services, manufacturing, trade and transportation, and government all moved the other way, each posting a higher openings rate than a year earlier. Read together, the past twelve months look less like a uniform slowdown and more like a reshuffling: demand cooling sharply in one formerly hot sector while building steadily in several others that get far less attention in general hiring coverage.
Section 04
Where the leverage currently sits
Private education and health services posted the highest openings rate of any sector in July 2026, at 5.3 percent, on a level of 1.553 million open positions, the second largest of any sector after professional and business services. Its hires rate, though, was a comparatively modest 2.8 percent. That combination, a lot of unfilled roles and a slower pace of actually filling them, is the clearest sign of unmet demand in the whole table. Employers in this sector are advertising faster than they are hiring, which historically has meant more room for a candidate to negotiate and shorter time waiting for a first offer once an application is genuinely considered.
Professional and business services tells a more complicated story. Its openings rate, 4.8 percent, is the second highest in the table, and its hires rate, 4.0 percent, looks healthy on its own. But the underlying JOLTS release for July 2026 noted that hires in this sector fell by 188,000 over the month, a real deceleration sitting underneath a still-respectable headline rate. Treat this sector as active but cooling rather than either hot or cold.
Section 05
Where churn, not shortage, explains high hiring
Leisure and hospitality looks, at first glance, like the most active hiring sector in the country. Its hires rate, 5.2 percent, is the highest of any industry tracked. Look at the rest of its row before drawing a conclusion from that alone. Its separations rate is 5.3 percent, essentially matching the hires rate, and its quits rate, 3.4 percent, is also the highest in the table.
That is a sector defined by churn rather than shortage. People move into these jobs quickly, and they move out again almost as quickly, whether by choice or otherwise. For a job seeker, this means real advantages, most obviously speed: these are, in practice, among the fastest jobs to land in the entire economy right now. It also means the honest expectation should be a high-turnover role rather than a long-tenure one, at least at entry level.
Trade, transportation, and utilities sits in a similar but milder version of the same pattern, with a 3.7 percent hires rate against a 2.6 percent quits rate. Within that broad category, retail trade specifically has historically carried a notably higher quits rate than wholesale trade or transportation and warehousing, a pattern consistent with high customer-facing turnover rather than a sector-wide shortage of workers.
Section 06
Sectors with less movement
Government sits at the opposite end of the table on almost every measure: the lowest hires rate, 1.3 percent, and the lowest quits rate, 0.8 percent, of any sector. Both numbers point in the same direction. Government hiring processes are slower, positions turn over less often once filled, and once you are in, people tend to stay. If you are targeting a government role, the honest expectation is a longer process from application to offer, not a sign that nobody is being hired.
Financial activities shows a related but distinct pattern: a moderate openings rate, 4.2 percent, paired with the second-lowest hires rate in the table, 1.6 percent. The same JOLTS release noted layoffs and discharges in finance and insurance falling by 22,000 over the month, which points toward a sector that is being more selective and cutting fewer people, rather than one that is either shrinking or actively expanding its headcount. Manufacturing shows something similar in a different combination, an openings rate matching the national average at 4.4 percent but a hires rate of only 2.3 percent, suggesting the roles that are open are proving harder to fill than average, which is often a sign of a skills or credential gap between the postings and the available applicant pool rather than a lack of postings.
Section 07
How to use this in your search
None of these numbers tell you which specific employer is hiring, and none of them replace actually reading a posting closely. What they do is help you spend your effort where the odds are genuinely better rather than where a headline told you to look.
Favor sectors where the openings rate runs meaningfully ahead of the hires rate, which is where unmet demand is real rather than advertised. Private education and health services is currently the clearest example of that gap in the data above. Be realistic about churn-heavy sectors like leisure and hospitality: they are fast to get into, which has real value if you need income quickly, but plan for shorter tenures as the norm rather than the exception. Build in more patience for government and financial activities, where low hires and quits rates both signal a slower, more deliberate process rather than a closed door. And once you have picked a sector worth targeting, cross-check the pay before you commit real time to it. Our guide on reading BLS salary percentiles walks through how to check whether a given occupation's pay, in that sector, actually works for you.
Section 08
Sources
All figures above come from the same federal survey, cross-checked across its current and prior releases.
- U.S. Bureau of Labor Statistics, Job Openings and Labor Turnover Survey, July 2026, released September 1, 2026. bls.gov
- U.S. Bureau of Labor Statistics, Table A, Job openings, hires, and total separations by industry, July 2026. bls.gov
- U.S. Bureau of Labor Statistics, Job Openings and Labor Turnover Survey, archived release covering July 2025, published September 3, 2025. bls.gov
JOLTS is a survey of employers, not job seekers, and its industry rates are seasonally adjusted and subject to revision in later releases. We will revisit this piece as new months of data arrive.
Pro tips
Do these
Compare the openings rate to the hires rate for a sector, not just one number on its own; a wide gap between the two is the real signal of unmet demand.
Treat a high quits rate in service sectors like leisure and hospitality as a sign of speed and churn, not automatically a warning sign about conditions.
Budget more patience for government and financial roles, where slower hiring is the normal pattern rather than a sign nothing is happening.
Check the year-over-year change, not just the latest month, since a sector's openings rate can move several points in either direction within a year.
Avoid these
Delete these
Assuming the sectors with the most media coverage, like technology, are automatically the ones with the most current demand for workers.
Reading a high hires rate in isolation without checking the matching separations and quits rates, which can reveal churn rather than growth.
Ignoring the year-over-year trend and treating a single month's snapshot as a permanent ranking.
Targeting a sector based on its openings rate alone without checking whether the pay in that sector, for your specific occupation, actually works for you.
Put this into a resume
Building and editing are free, and free PDFs carry a small watermark.
Try the job matcherQuestions
Frequently asked questions
How this guide is maintained
We review this guide every quarter and after any change to the hiring rules or portal behaviour it describes. It was last reviewed on 2026-09-28T03:49:55.035Z. Figures come from named sources, shown beside the number. Where we are estimating rather than measuring, we say so.
By the numbers
7.3M
job openings nationwide in July 2026
BLS Job Openings and Labor Turnover Survey, July 2026
5.3%
openings rate in private education and health services, the highest of any sector
BLS JOLTS, Table A, July 2026
-3.1 pts
year-over-year drop in the information sector's openings rate, the sharpest pullback of any industry
BLS JOLTS, July 2025 vs July 2026
0.8%
quits rate in government, the lowest of any sector tracked
BLS JOLTS, July 2026
Try it
Check the guide against your own file
Everything above is general. Your resume is not. Paste it in and the checker tells you which of these points your file actually breaks.
Check your resume free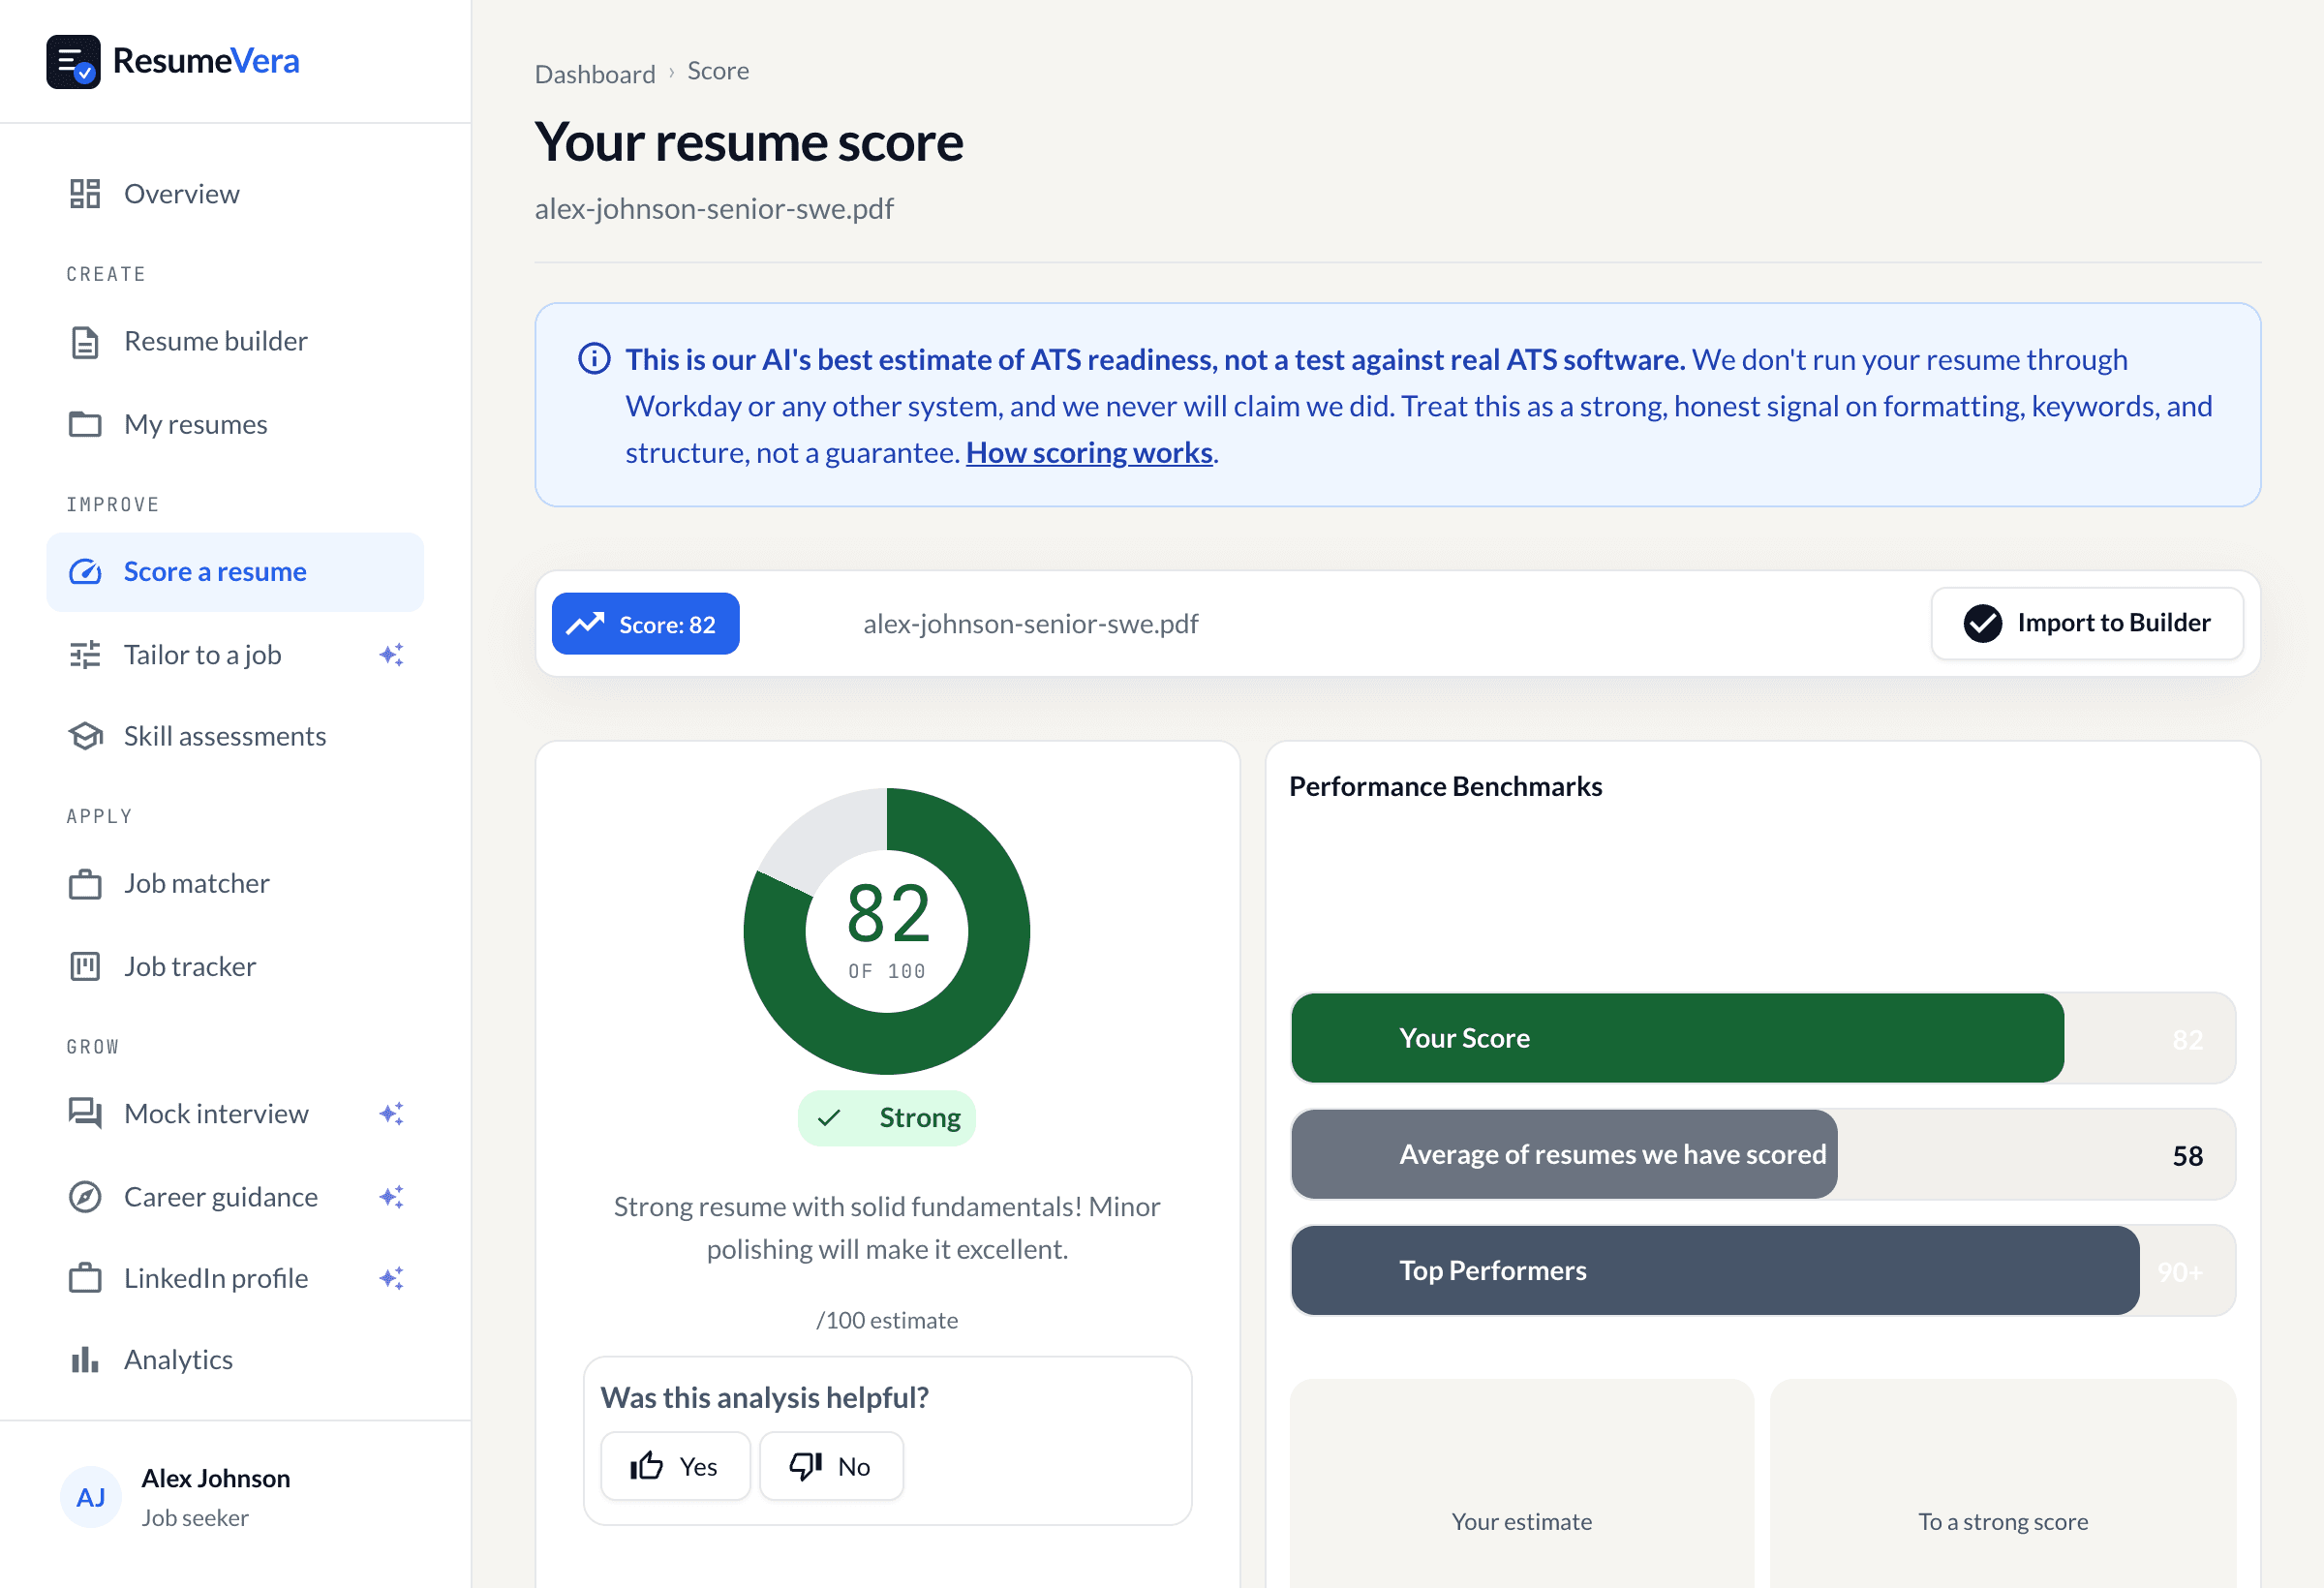
The real score page, with a sample resume and sample scores.
Is your resume ATS ready?
Run a free ATS score check and get specific improvements in seconds.