How long does it actually take to find a job in 2026? What the federal data says
Job Search · ResumeVera Editorial · September 28, 2026 · 9 min read

Somewhere around week nine or ten of a job search, a specific kind of doubt sets in. Not the anxiety of week one, when everything still feels manageable, but something quieter and worse: the sense that everyone else is finding work faster than you are, and that the length of your own search says something about you.
It usually does not. We pulled the federal government's own numbers on how long unemployment actually lasts in 2026, checked them against two separate releases, and traced the trend back a few years to see whether searches have genuinely gotten longer or whether it only feels that way. They have. We have written before about why job postings themselves can mislead you, in our pieces on ghost jobs and the September hiring surge. This time we looked past the postings, at the search itself.
Two different questions, two different numbers
These figures come from the Current Population Survey, a sample of about 60,000 eligible households that the Census Bureau conducts each month on behalf of the Bureau of Labor Statistics. It is the same survey behind the headline unemployment rate, and anyone it counts as unemployed is asked directly how long they have been looking for work, which is where the duration numbers come from.
Each month the survey produces two duration figures that get confused with each other constantly: the mean and the median. The median is the more useful number for most people, because it tells you where the typical job seeker actually sits. Half of unemployed people have been searching for less time than the median, and half for more. The mean is an average, and averages get pulled upward by a relatively small number of very long searches, the same way one very high salary can drag up an office's average pay without moving anyone else's paycheck at all.
In August 2026, the most recent month with data as we publish this, the median duration of unemployment was 11.4 weeks. The mean was 26.3 weeks, more than double. That gap is not a data error. It is the shape of the problem. Most people find something within a few months, and a smaller group is stuck for a very long time, and that second group pulls the average far past what a typical search actually looks like.
The number that has been climbing for two years
The figure worth watching closest is not the mean or the median on its own, but the share of unemployed people who have been out of work for 27 weeks or more, which is the federal government's own definition of long-term unemployment.
In August 2026, that share was 27.0 percent of all unemployed people, or about 1.9 million people. We checked this figure against two separate BLS releases, the Employment Situation summary and the detailed duration table behind it, and they agree.
Now look at where that number has come from. In February 2020, the month before the pandemic upended the labor market, long-term unemployment sat at 19.2 percent. By September 2024 it had climbed to 23.7 percent. In July 2025 it reached 24.9 percent, the highest share since February 2022. A year later, in August 2026, it stands at 27.0 percent.
That is a steady climb, not a spike. Four readings, each roughly a year apart, each one higher than the last. None of them come close to the pandemic peak of 42.9 percent in March 2021, when entire sectors had shut down and reopening took months. But every one of them sits well above the pre-pandemic norm, and the gap has been widening for two straight years rather than closing.
How today compares with past downturns
Numbers are easier to judge next to history. Here is the mean duration of unemployment at several points over the past two decades, each one sourced to the same BLS series, republished by the Federal Reserve Bank of St. Louis.
| Period | Mean duration |
|---|---|
| December 2007, just before the financial crisis | 16.6 weeks |
| December 2010, deep in that recovery | 34.7 weeks |
| December 2019, just before the pandemic | 20.7 weeks |
| December 2024 | 23.7 weeks |
| July 2025 | 24.9 weeks |
| August 2026, most recent available | 26.3 weeks |
Two things stand out. The current figure is nowhere near the 2010 peak, when the aftermath of the financial crisis kept the average job seeker out of work for close to eight months. But it is also well above where things sat in 2019, and it has been rising in a fairly straight line rather than settling back down the way duration eventually did after 2010. Whatever is driving this, it has not resolved itself the way past cycles did, at least not yet.
Why the search itself has gotten harder
Part of the explanation shows up in a completely different federal survey. The Job Openings and Labor Turnover Survey for July 2026 recorded about 7.3 million job openings against roughly 5.1 million hires that month. Quits ran at 3.1 million and layoffs and discharges at 1.7 million.
That gap between openings and hires, more than two million wide, is a structural fact about the current labor market rather than a monthly blip. Openings sitting well above hires means employers are advertising roles faster than they are filling them, whether because they are being more selective, because the right candidates are harder to find, or because hiring itself has simply slowed down. Any of those explanations produces the same effect on the ground: longer waits between application and offer, and more people sitting in the queue at any given moment, which is consistent with the rising duration numbers above rather than separate from them.
It is not falling evenly on everyone
Duration is not broken out by education level in the same table, but the unemployment rate is, and it tells a related story about who carries more risk of a long search in the first place. In August 2026, the unemployment rate for people 25 and over with a bachelor's degree or higher was 2.7 percent. For people with some college or an associate degree it was 3.7 percent. For high school graduates with no college it was 4.4 percent, and for people without a high school diploma it was 4.7 percent, nearly double the rate for degree holders.
That is a different measurement than duration, and we want to be precise rather than blur the two together. A lower unemployment rate does not guarantee a shorter search once you are out of work. What it does show is that the risk of being unemployed at all is not distributed evenly, and it has not been for as long as the Bureau of Labor Statistics has tracked it this way.
What this means if you are in the middle of a search right now
None of this is a reason to panic, and it is also not a reason to assume things will resolve themselves quickly. A few practical conclusions follow directly from the numbers above.
A search running past two or three months is not unusual. The median is 11.4 weeks, which is close to three months, and that figure is the midpoint, meaning plenty of people run considerably longer than that without anything being wrong with how they are searching. If you are at week eight or ten, you are not behind some normal schedule. You are inside it.
Budget for longer than feels comfortable. If more than a quarter of unemployed people are past month six, treating three months as a worst case plans for a scenario that is common rather than rare. That should shape how you think about savings, timing, and any decisions you are putting off until you land something.
A long search is not a verdict on you personally. The share of long-term unemployed has risen for four straight annual readings we could trace, across a period that includes plenty of people with strong resumes and solid track records. A structural shift in how long searches take is a labor market fact, not a personal one, even though it rarely feels that way in month five.
Once a search runs past the two-month mark, treat it like the multi-month project it has effectively become. Applications start piling up across different weeks, and memory becomes unreliable about who has gone quiet, who asked for a follow-up, and which roles are worth revisiting. A job tracker keeps that organized instead of living in your head or in a spreadsheet you stop updating by week three, and it matters more the longer a search actually runs, which for a growing share of people in 2026 is longer than they expected going in.
Sources
- U.S. Bureau of Labor Statistics, The Employment Situation, August 2026, released September 4, 2026. bls.gov
- U.S. Bureau of Labor Statistics, Table A-12, Unemployed persons by duration of unemployment, August 2026. bls.gov
- U.S. Bureau of Labor Statistics, Table A-4, Employment status of the civilian population 25 years and over by educational attainment, August 2026. bls.gov
- U.S. Bureau of Labor Statistics, Employment Situation Technical Note, August 2026, on Current Population Survey methodology. bls.gov
- Federal Reserve Bank of St. Louis, FRED, Average (Mean) Duration of Unemployment, series sourced from the Bureau of Labor Statistics. fred.stlouisfed.org
- U.S. Bureau of Labor Statistics, 19.2 percent of the unemployed had been jobless for 27 weeks or more in February 2020, The Economics Daily. bls.gov
- U.S. Bureau of Labor Statistics, Long-term unemployed accounted for 23.7 percent of total unemployed in September 2024, The Economics Daily. bls.gov
- U.S. Bureau of Labor Statistics, Number of long-term unemployed was 1.8 million in July 2025, The Economics Daily. bls.gov
- U.S. Bureau of Labor Statistics, Job Openings and Labor Turnover Survey, July 2026, released September 1, 2026. bls.gov
Duration and long-term unemployment figures are revised as new months of data arrive. We will update this piece when the September 2026 release changes the picture.
Questions
Frequently asked questions
Get free ATS tips every week
Actionable resume and ATS tips, when we publish them. No spam. Unsubscribe any time.
Related Articles
Why free resume builders charge you to download, and what to check before you pay
You build a resume on a site advertised as free, then hit a paywall at the download button. That pattern has a name, a body of law behind it, and a live federal antitrust case. Here is how the billing model works and what to check before you enter a card.
Read More
Do cover letters still matter? What the surveys actually say
One survey says 83 percent of hiring managers read cover letters. Another says 51.7 percent of recruiters never do. Both are real. We looked at why the numbers disagree so violently, and the reason turns out to be the answer to the question.
Read More

Entry level job search in the AI era: what the data actually says
Graduate hiring has been unusually hard for two years, and the explanation you keep hearing is AI. The best evidence for that comes from a Stanford study using payroll records for millions of workers. It is more specific than the headlines suggest, and what it implies for your resume is not what most advice tells you.
Read More
Try it
Check this against your own resume
The post above is general. Your file is not. The checker reads it the way a parser would and tells you which of these points it actually breaks.
Check your resume free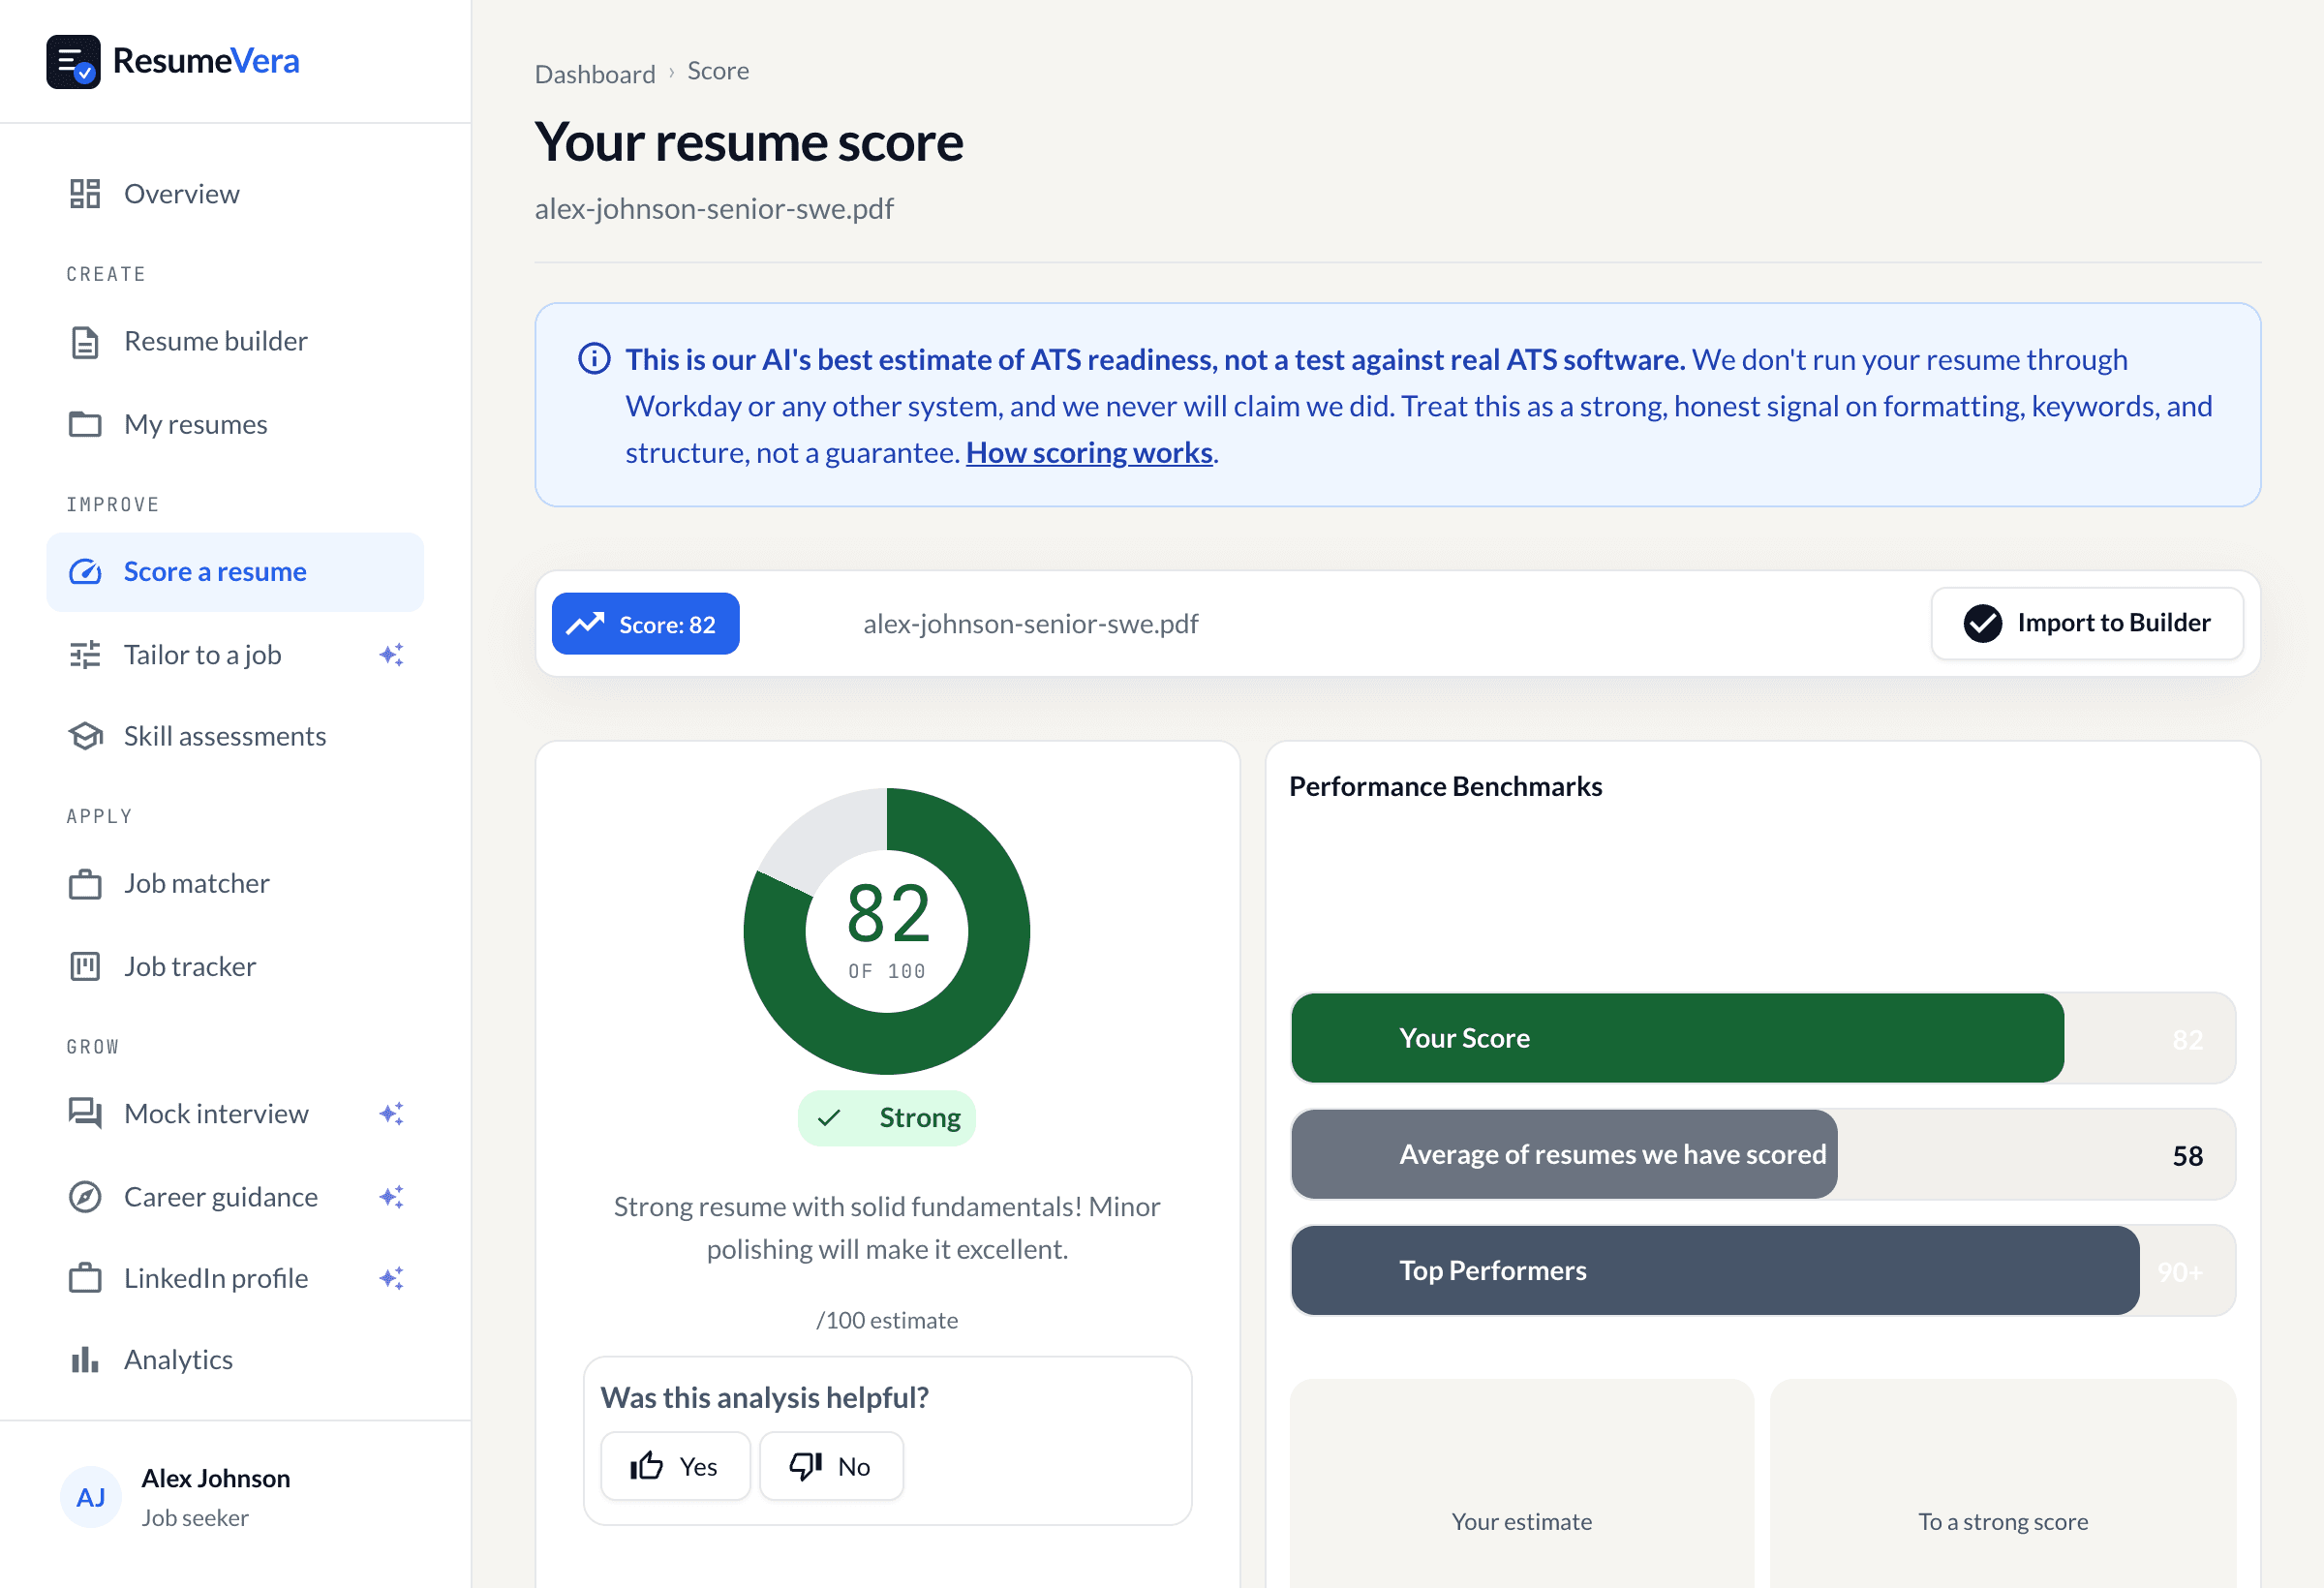
The real score page, with a sample resume and sample scores.
Now check it against your own resume
An honest resume score in seconds. No account, no card.