Education and earnings, 2026
Does a college degree still pay off in 2026? What BLS wage and unemployment data by education show
Every September the Bureau of Labor Statistics quietly publishes the clearest answer available to a question most people only guess at: what more education is actually worth, in wages and in unemployment risk, at every level from no diploma to a doctorate. Here is the full table, what the gap adds up to, and what it does not capture.
The ResumeVera editorial team
Resume and hiring research, reviewed against current employer guidance.
Updated Oct 12, 2026
11 min

Section 01
What this data actually measures
Once a year, usually in September, the Bureau of Labor Statistics publishes a short Career Outlook article called Education Pays, built from the Current Population Survey. It reports median usual weekly earnings and the unemployment rate for full-time wage and salary workers age 25 and over, broken out by the highest level of education each person has completed.
The 2025 edition, published in September 2026, carries one unusual caveat worth stating up front. Because data collection for October 2025 did not happen, the 2025 annual figures are an 11-month average rather than a full 12-month one. The BLS itself flags this, and says the 2025 numbers are not strictly comparable to other years' full annual averages. Treat everything below as a close, current estimate rather than an exact figure, which is also simply how the government presents it.
Section 02
The full table, every level of education
Here is the complete 2025 picture, from less than a high school diploma up to a doctoral degree.
| Educational attainment | Median weekly earnings | Unemployment rate |
|---|---|---|
| Less than a high school diploma | $770 | 6.1% |
| High school diploma, no college | $966 | 4.3% |
| Some college, no degree | $1,062 | 3.8% |
| Associate's degree | $1,135 | 3.0% |
| Bachelor's degree | $1,578 | 2.8% |
| Master's degree | $1,876 | 2.6% |
| Professional degree | $2,294 | 1.9% |
| Doctoral degree | $2,307 | 1.8% |
Two patterns hold across the whole table, not just at the well-known high school versus bachelor's comparison. Earnings rise at every single step up, with no level where more education pays less than the one below it. Unemployment falls at almost every step too, from 6.1 percent at the bottom to 1.8 percent at the top, a gap of 4.3 percentage points, more than three times lower at the top than the bottom.
Section 03
What the weekly gap adds up to
A weekly number is easy to underweight, so it helps to annualize it. These are nominal figures, meaning they do not build in future raises or inflation, and they describe two different people's current pay, not one person's future path. Treat them as a floor on the gap, not a forecast.
A high school graduate with no college earning the median $966 a week clears about $50,230 a year. A bachelor's degree holder at the median $1,578 a week clears about $82,060, a gap of roughly $31,800 a year, before either person has a single raise. Run that gap across just ten years at a flat rate, with no promotions or cost of living increases factored in on either side, and it is already past $318,000.
The same math holds at smaller steps on the ladder. An associate's degree over a high school diploma alone is worth about $8,790 a year at the median, $169 a week. Some college with no finished degree is worth about $4,990 a year over a high school diploma, meaningfully less than finishing an associate's, which is itself useful if you are weighing whether to go back and complete a credential you started. A master's degree over a bachelor's adds roughly $15,500 a year at the median, a smaller jump in percentage terms than the high school to bachelor's step, but still a real one.
Section 04
Unemployment risk falls in the same direction, and the same caution applies
The unemployment figures move in lockstep with the earnings figures, and that consistency across two genuinely different measures, pay when working and the risk of not working at all, is part of why this table gets cited so often. A bachelor's degree holder faced a 2.8 percent unemployment rate in 2025 against 4.3 percent for a high school graduate with no college, and 6.1 percent for someone without even a high school diploma.
Be careful about what this does and does not prove. This is a correlation observed across the whole labor force, not a controlled experiment on any individual. People with more formal education also differ, on average, in industry, geography, age distribution and other factors the headline table cannot separate out. The BLS presents this as a description of the current workforce, not a causal claim that a specific credential will move a specific person from one unemployment rate to the other. That distinction matters more the more directly this table gets used to argue for or against a specific decision.
Section 05
What this table does not capture
Honesty about the limits here matters as much as the numbers themselves, and a few are significant enough to flag directly.
Field of study is not in this table at all. A bachelor's degree is one line in this release, but a degree in nursing, computer science, elementary education and fine arts can sit at very different points on the actual pay distribution, often further apart from each other than the bachelor's median is from the associate's median above it. This table tells you what the typical bachelor's degree holder earns. It cannot tell you what your specific major, program or school would have been worth.
The cost of getting the credential is not in this table either, and we are not going to estimate one here. What a specific degree costs net of aid, and what debt, if any, it required, varies enormously by institution, program length, financial aid, and personal circumstance, more than we could responsibly generalize into a single number without misleading you. If you are weighing a specific credential against a specific cost, that calculation has to use your own numbers, not a national median.
And the table describes people who already hold each credential, not what would happen to any one specific person if they obtained one more. Selection into higher education correlates with other things, prior academic preparation, family resources, geography, that also affect earnings on their own. None of that means the gap is fake. It means the gap is a description of today's workforce, and a useful one, rather than a guaranteed personal outcome.
Section 06
How to use this if you are weighing a credential or positioning the one you have
If you are deciding whether to finish a degree you started, the some college versus associate's comparison above is directly relevant: finishing adds roughly $3,800 a year over stopping partway, on top of whatever the associate's credential itself is worth over a high school diploma. If you are weighing a master's against staying at a bachelor's, the roughly $15,500 median gap is real, but it is also the number most worth checking against your specific field and employer before treating it as settled, since graduate degree value varies by occupation more than the undergraduate step does.
Either way, the next useful move is checking what your actual target occupation pays, rather than reasoning from the education table alone. Education level and occupation interact, and the Bureau of Labor Statistics publishes wage data for roughly 830 specific occupations separately from this table. A role like data analyst, which typically expects a bachelor's degree, has its own percentile breakdown by metro that will tell you far more about a real offer than the national education-level median above. Once the target role and pay are clear, these data analyst resume examples show how to present a degree, a bootcamp, or a self-taught path in a way that reads as evidence of capability rather than a credential alone.
If you already hold the credential and the question is whether your current pay reflects it, our separate guide on reading BLS salary percentiles walks through the same kind of government wage data at the occupation level, which is the more precise benchmark once you already know your field.
Section 07
Sources
Every figure in the table above traces back to the same federal release.
- U.S. Bureau of Labor Statistics, Career Outlook, Education pays, 2025, published September 2026. bls.gov
- U.S. Bureau of Labor Statistics, Current Population Survey, source data underlying the Education pays series. bls.gov
Annualized dollar figures and gaps between education levels in this guide are ResumeVera calculations from the BLS weekly earnings figures above, using a standard 52-week year. They are nominal and do not account for future raises, inflation, debt, or field of study. This data is updated annually. We will revisit this guide when the 2026 edition is released.
Pro tips
Do these
Compare education levels using weekly or annual earnings, not just the headline unemployment rate, since both move together but tell you different things.
Check the occupation-level BLS wage data for your specific target role before relying on the education-level national median alone.
If you are weighing a credential against its cost, use your own program's actual price and aid package, not a generalized national figure.
Remember the 2025 figures are an 11-month average, not a full year, per the BLS's own caveat.
Avoid these
Delete these
Treating the education pays table as proof that a specific degree will cause a specific income, rather than a description of the current workforce.
Ignoring field of study, which can matter more than the credential level itself.
Comparing a national weekly or annual figure to a specific job offer without checking the occupation and metro-level data separately.
Forgetting that the earnings gap compounds every year someone works, not just in the first year after finishing a credential.
Put this into a resume
Building and editing are free, and free PDFs carry a small watermark.
See roles that match your backgroundQuestions
Frequently asked questions
How this guide is maintained
We review this guide every quarter and after any change to the hiring rules or portal behaviour it describes. It was last reviewed on October 12, 2026. Figures come from named sources, shown beside the number. Where we are estimating rather than measuring, we say so.
By the numbers
$1,578
Median weekly earnings for bachelor's degree holders, full-time workers 25 and over
BLS Career Outlook, Education pays 2025, published September 2026
2.8%
Unemployment rate for bachelor's degree holders, versus 4.3% for high school graduates with no college
BLS Career Outlook, Education pays 2025
$31,800+
Approximate extra annual earnings a bachelor's degree holder makes over a high school graduate, full-time, before accounting for debt or major
ResumeVera calculation from BLS Career Outlook, Education pays 2025
11-month
The 2025 figures are an 11 month average because October 2025 data could not be collected, so treat them as close estimates, not exact annual figures
BLS Career Outlook, Education pays 2025
Try it
Check the guide against your own file
Everything above is general. Your resume is not. Paste it in and the checker tells you which of these points your file actually breaks.
Check your resume free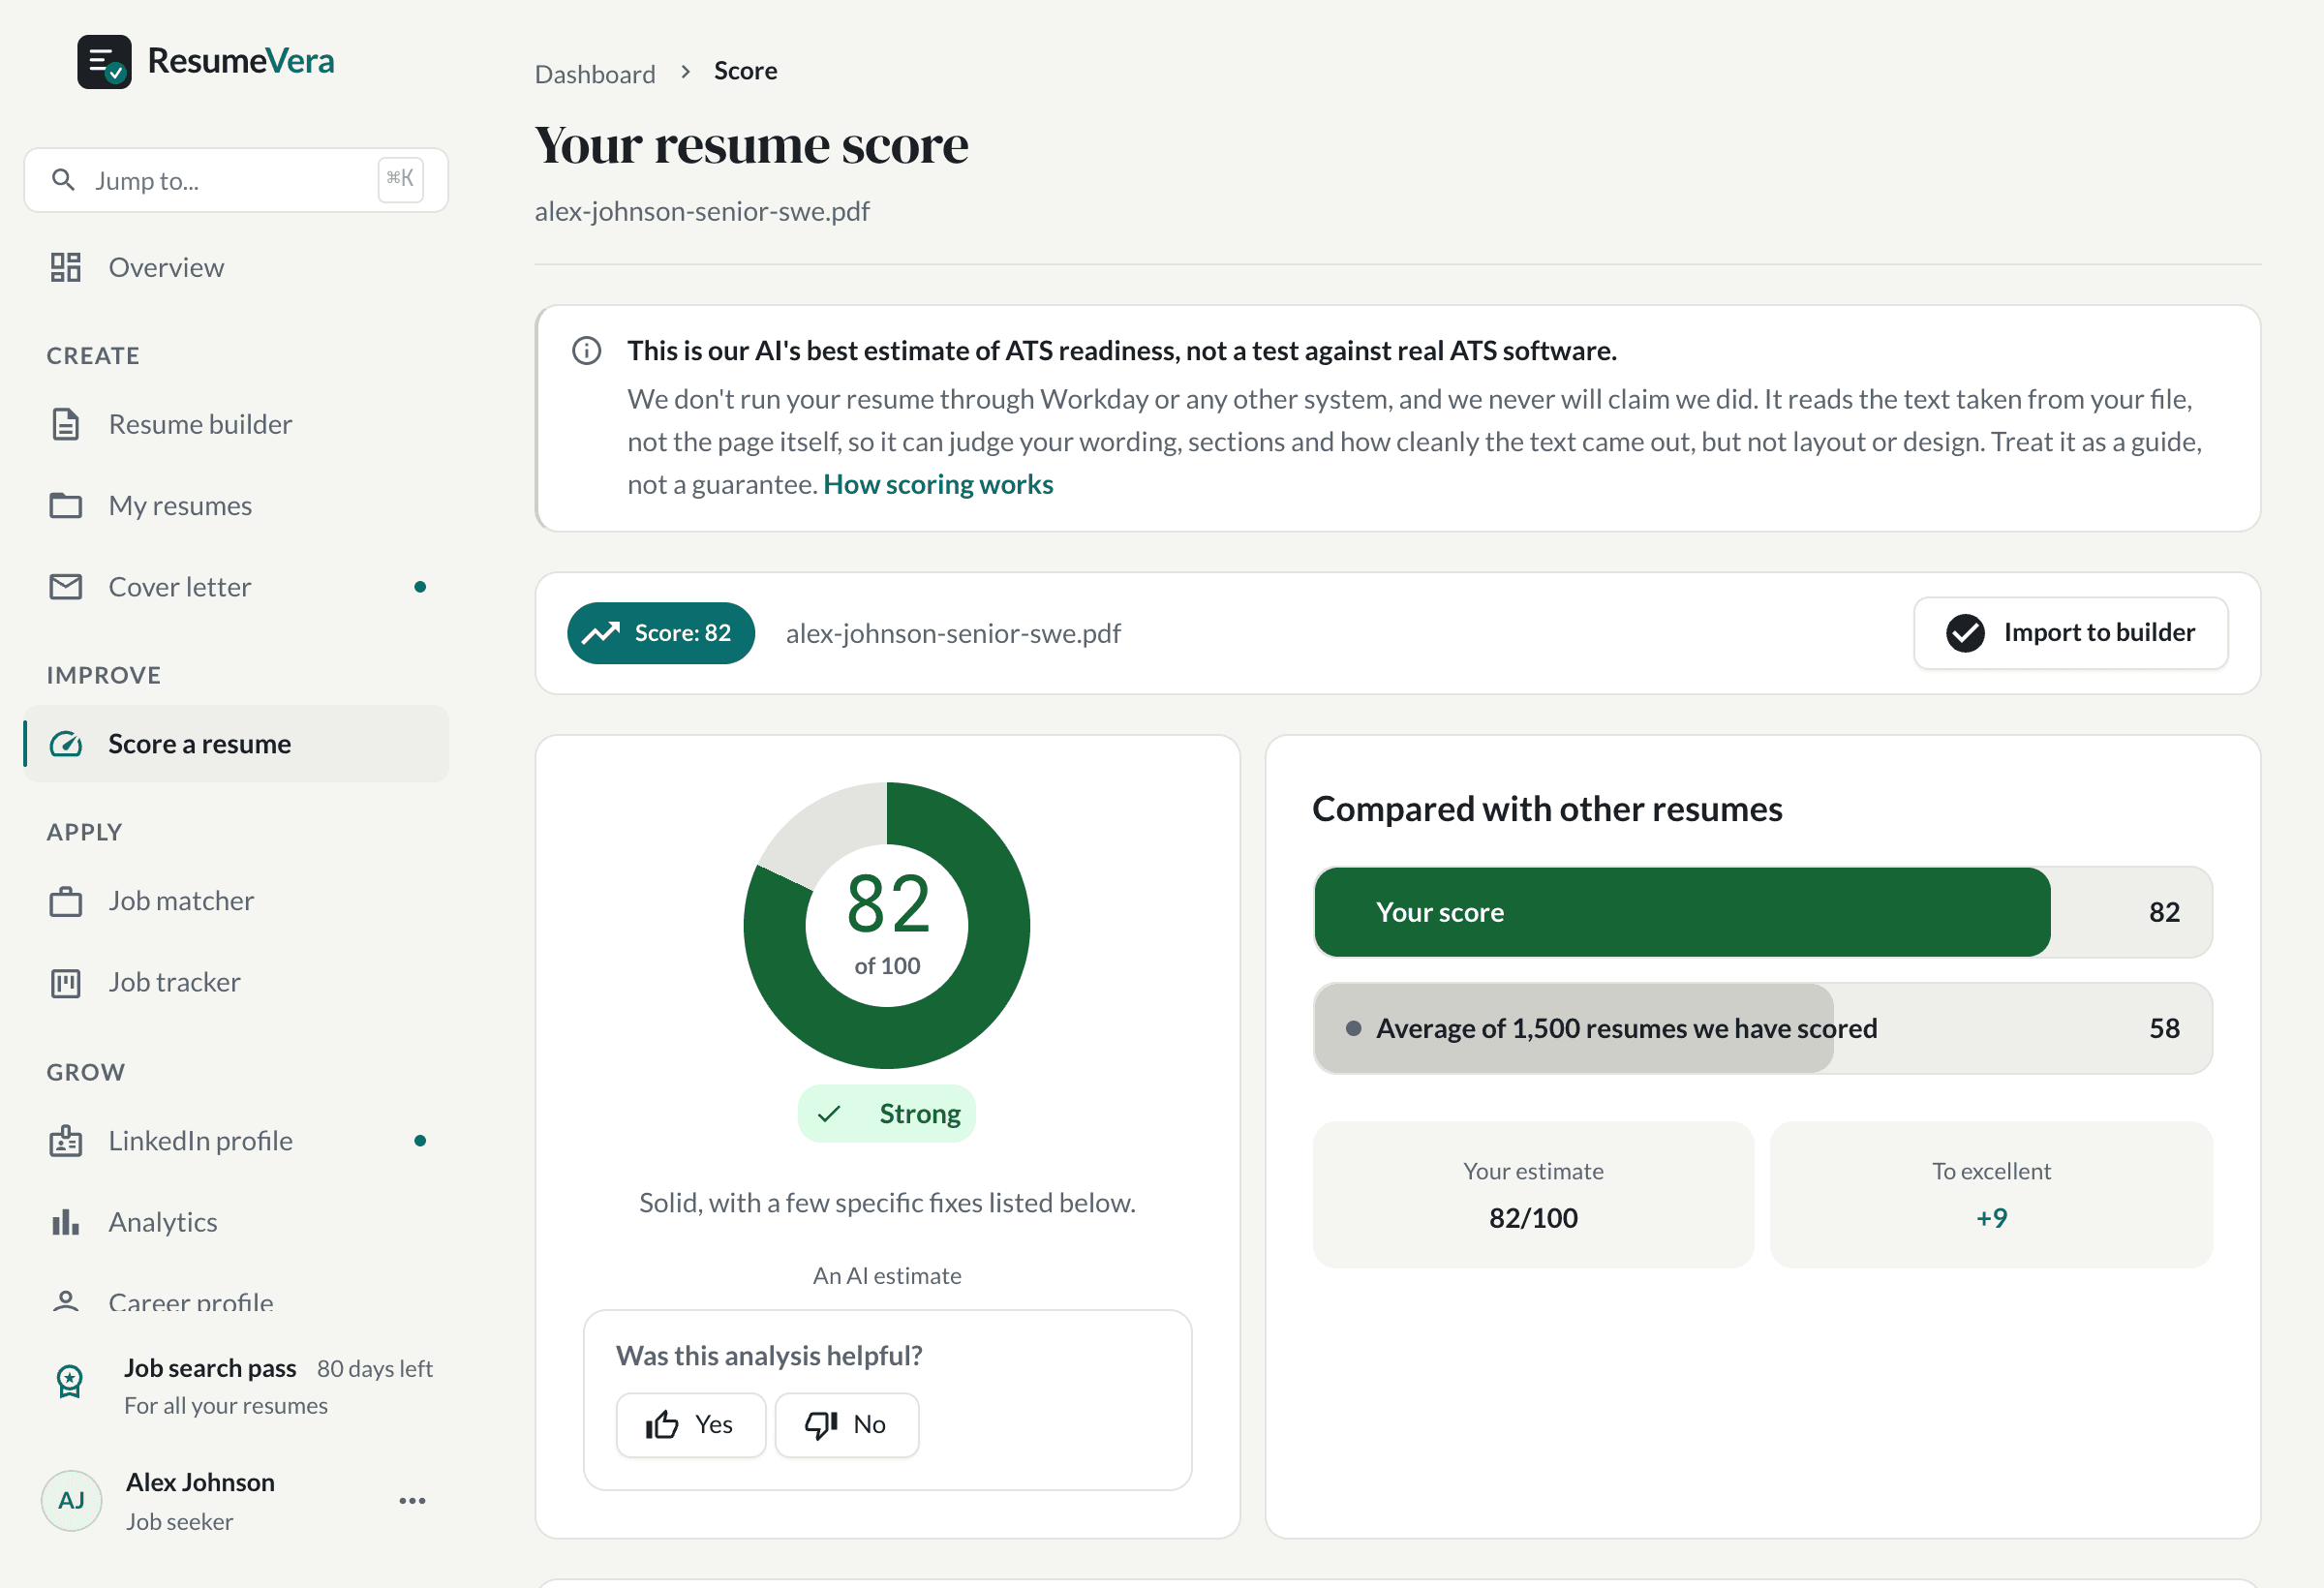
The real score page, with a sample resume and sample scores.
Is your resume ATS ready?
Run a free ATS score check and get specific improvements in seconds.