How long are people actually staying at their jobs now? What the newest BLS tenure data says
Job Search · ResumeVera Editorial · October 12, 2026 · 9 min read

Every two years, in January, the Census Bureau asks a very specific question on behalf of the Bureau of Labor Statistics: how long have you been with your current employer. It is not a survey anyone sees coming. There is no press cycle built around it the way there is for the monthly jobs report. But the answer, released again on September 24, 2026, says more about what a normal career actually looks like right now than almost any other number the government publishes.
If you have ever worried that two or three jobs in five years makes you look unstable, or wondered whether staying somewhere for a decade is unusual, this is the data that actually answers the question, rather than a hiring manager's gut feeling or a LinkedIn post about how things used to be.
A number that moved for the first time in years
Median tenure for wage and salary workers was 4.1 years in January 2026. That is up from 3.9 years in January 2024, which was the lowest reading in a decade of this same biennial survey. It is also still below the 4.2 years recorded in both 2016 and 2018, so the honest read is a partial recovery from a low point, not a new high.
| Survey year (January) | Median tenure, all workers |
|---|---|
| 2016 | 4.2 years |
| 2018 | 4.2 years |
| 2020 | 4.1 years |
| 2022 | 4.1 years |
| 2024 | 3.9 years |
| 2026 | 4.1 years |
Four of the last six readings sit within a tenth of a year of each other. The 2024 dip is the outlier, not the trend, which is worth knowing if you have seen that single low figure cited as evidence that nobody stays anywhere anymore. The newest data does not support that story as cleanly as the 2024 number alone suggested.
The gap between men and women narrowed sharply
Men had a median tenure of 4.3 years in January 2026, up only slightly from 4.2 years in 2024. Women had a median of 4.0 years, up from 3.6 years, a considerably larger jump. The overall gap between men and women shrank from six tenths of a year to three tenths in a single survey cycle, driven almost entirely by women's tenure rising rather than men's falling.
The survey does not explain why on its own, and we are not going to guess at a cause the data cannot support. What it does show clearly is that the direction of change was not symmetric, and that is worth knowing before assuming the two trends are the same story.
Age explains more of the variation than anything else
Of every factor in this release, age is the one that moves the number the most, and it is not close.
| Age group | Median tenure, January 2026 |
|---|---|
| 16 to 17 | 0.7 years |
| 18 to 19 | 0.8 years |
| 20 to 24 | 1.5 years |
| 25 to 34 | 3.0 years |
| 35 to 44 | 4.7 years |
| 45 to 54 | 7.0 years |
| 55 to 64 | 9.6 years |
| 65 and over | 9.9 years |
Workers aged 55 to 64 have a median tenure more than three times that of workers aged 25 to 34. Some of that is mechanical. Older workers have simply had more years in the labor force in which a long stretch at one employer could accumulate. But it also means that comparing your own tenure to a single national average, without adjusting for your own age bracket, will almost always mislead you in one direction or the other.
Among workers 25 and older, 30.1 percent had been with their current employer for 10 years or more, essentially unchanged from 30.2 percent in 2024. That share climbs to 52.6 percent for workers aged 60 to 64 and falls to 20.3 percent for workers in their late thirties, the same pattern showing up from a different angle.
Short tenure is actually down, not up
Here is the finding most at odds with how job-hopping usually gets discussed. The share of workers with 12 months or less at their current employer was 20.6 percent in January 2026, down from 22.2 percent in 2024.
The same table breaks this out further. Among workers aged 16 to 19, 74.1 percent have 12 months or less of tenure, which is close to definitional given how young that group is. Among workers 55 to 64, it is 9.2 percent. The release also reports this measure by race and ethnicity: 19.8 percent for White workers, 17.3 percent for Asian workers, 25.0 percent for Black workers and 24.2 percent for Hispanic or Latino workers. We are reporting those figures as the survey presents them, without attributing a cause the data itself does not establish.
Where you work changes the number as much as who you are
Industry turns out to carry almost as much weight as age. Public sector workers had a median tenure of 5.6 years in January 2026, well above the 3.9 years recorded in the private sector. Break the public sector down further and federal government workers had a median of 7.0 years, against 5.4 years each for state and local government.
Within the private sector, four industries tied for the longest median tenure at 4.9 years: financial activities, mining and oil and gas extraction, manufacturing, and information. Leisure and hospitality sat at the other end with a median of just 2.4 years, the shortest of any sector tracked.
One caveat the release itself flags: starting with the 2026 data, industries are classified under the 2022 Census system, so comparisons against years before that switch are not strictly apples to apples. Treat the current snapshot as more reliable than any year-over-year industry comparison drawn across that boundary.
The occupation split tells a similar story from a different angle
By broad occupation group, management, professional and related occupations had the longest median tenure at 4.9 years, with management occupations specifically reaching 6.1 years. Service occupations sat at the opposite end at 2.9 years overall, with food preparation and serving workers at 2.2 years and personal care and service workers at 2.8 years.
None of this means a service job is a worse job. It means the normal rhythm of that kind of work includes far more frequent moves between employers, which is useful context if you are comparing your own resume against a mental benchmark built around a corporate career.
What this means if your resume has more than one short stint
Put the pieces together and a pattern emerges that is more forgiving than most job-hopping advice assumes. Just over one in five workers nationally has a year or less with their current employer, and in some occupation groups and age brackets that share is far higher than one in five. Short tenure is common enough in large parts of the labor market that it is not, on its own, the red flag it is sometimes treated as.
If your own work history includes a few shorter stints, especially in occupations like customer service, retail or hospitality where turnover of this kind is the norm rather than the exception, the fix is rarely to hide it. It is to frame it clearly: group related short-term roles under a single heading if they were genuinely similar work, lead with what you accomplished in each stint rather than the dates themselves, and let the actual results carry the weight the tenure number otherwise would. These customer service representative resume examples show that framing in practice, for an occupation group where the government's own tenure data says shorter stints are simply typical.
If you are moving between several short-term roles right now, the more useful next step is making sure the resume itself reads cleanly regardless of how many employers it lists. A resume builder that handles multiple roles without burying your strongest points under repetitive formatting is worth more here than another paragraph of advice about how dates should look.
Sources
- U.S. Bureau of Labor Statistics, Employee Tenure in 2026, news release, published September 24, 2026. bls.gov
- U.S. Bureau of Labor Statistics, Employee Tenure news release archive, September 24, 2026 edition. bls.gov
- U.S. Bureau of Labor Statistics, Table 1, median years of tenure with current employer by age and sex, selected years 2016 to 2026.
- U.S. Bureau of Labor Statistics, Table 2, percent of employed wage and salary workers with 10 years or more of tenure, by age and sex, 2026.
- U.S. Bureau of Labor Statistics, Table 3, percent of employed wage and salary workers with 12 months or less of tenure, by age, sex, race and ethnicity, 2026.
- U.S. Bureau of Labor Statistics, Table 5, median years of tenure with current employer by industry, 2016 and 2026.
This survey is conducted every two years as a supplement to the Current Population Survey. We will revisit this piece when the January 2028 edition is released.
Questions
Frequently asked questions
Get free ATS tips every week
Actionable resume and ATS tips, when we publish them. No spam. Unsubscribe any time.
Related Articles

Is your raise actually keeping up with prices in 2026? What the wage data says
Three federal data sources answer the "am I getting ahead" question differently depending on how you ask it. Job switchers are clearly outrunning inflation. People who stay in their current job are barely breaking even. Here is what the real earnings report, the Employment Cost Index, and the Atlanta Fed's wage tracker each actually measure, and what to do with the gap between them.
Read More

How long does it actually take to find a job in 2026? What the federal data says
The median unemployed job seeker in 2026 has been searching for about eleven weeks. The average is more than double that, and the gap between the two numbers is the whole story. We checked the federal data on how long searches actually run, how that compares with past downturns, and what it means for planning your own.
Read More

Why free resume builders charge you to download, and what to check before you pay
You build a resume on a site advertised as free, then hit a paywall at the download button. That pattern has a name, a body of law behind it, and a live federal antitrust case. Here is how the billing model works and what to check before you enter a card.
Read More
Try it
Check this against your own resume
The post above is general. Your file is not. The checker reads it the way a parser would and tells you which of these points it actually breaks.
Check your resume free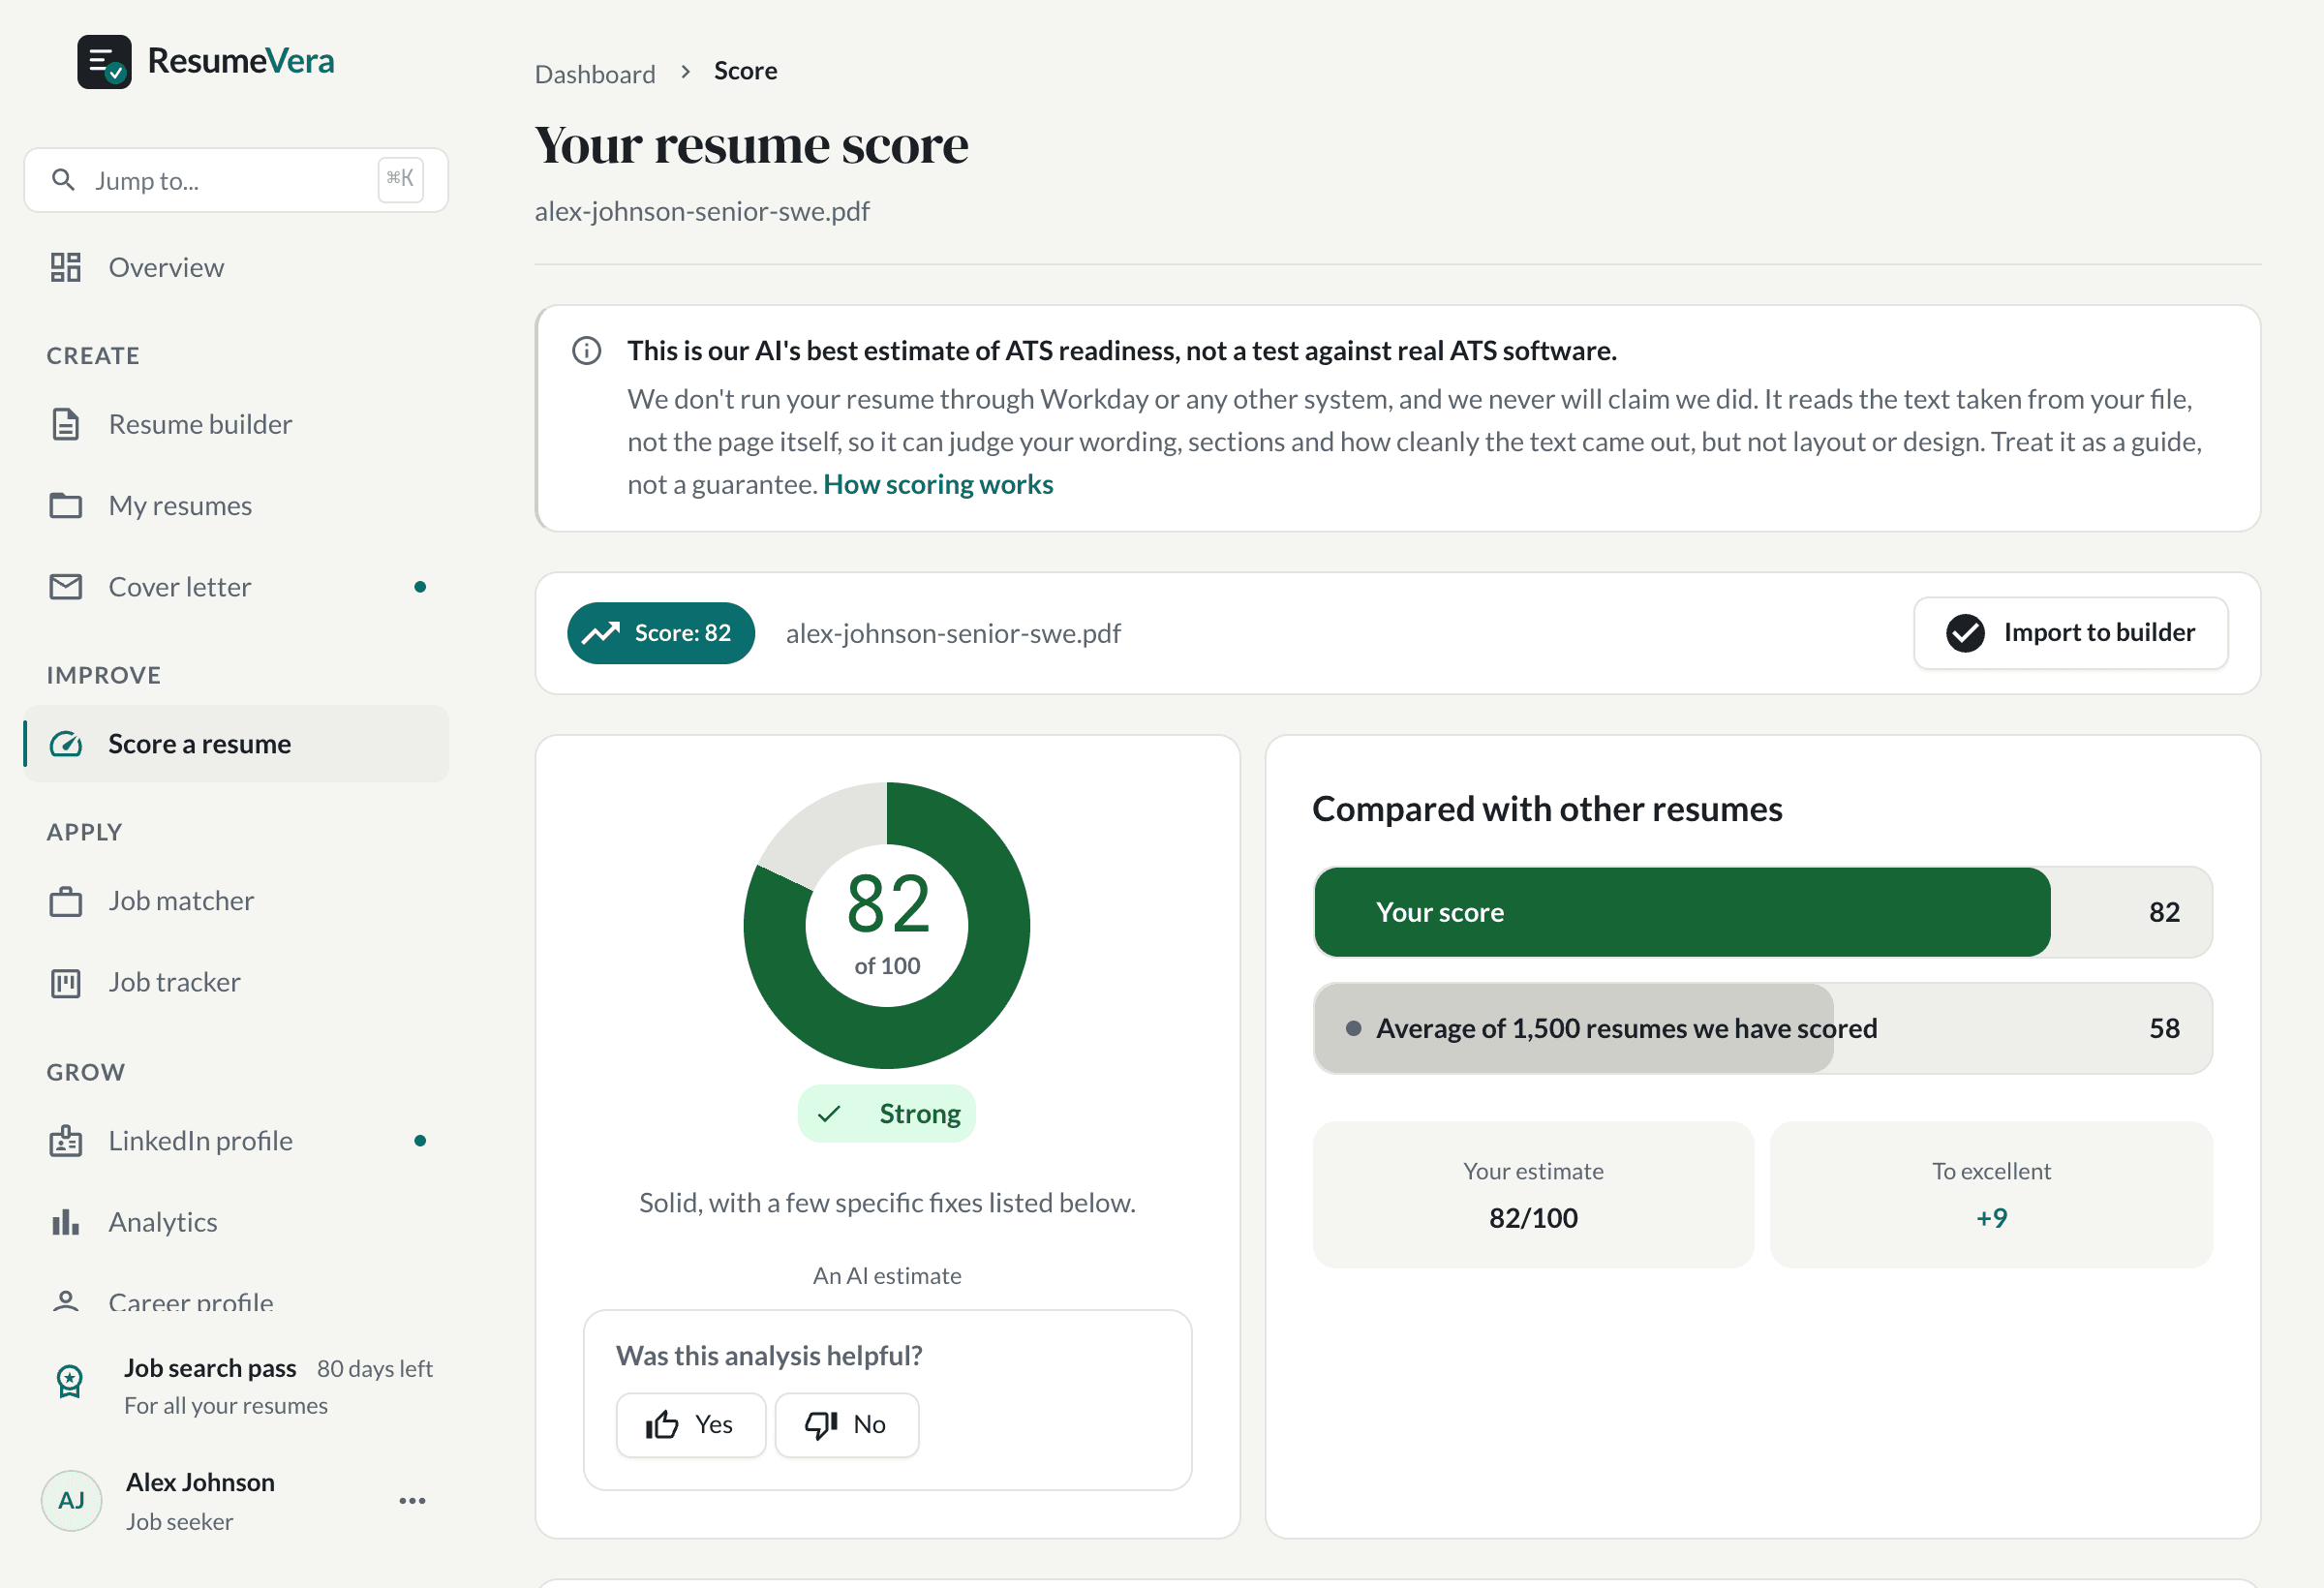
The real score page, with a sample resume and sample scores.
Now check it against your own resume
An honest resume score in seconds. No account, no card.