Career Planning Guide, 2026
The fastest-growing jobs through 2035, according to the government's own numbers
Most "jobs of the future" lists are built on trend pieces and conference keynotes. The Bureau of Labor Statistics publishes an actual ten-year forecast every two years, built from real employment, wage, and industry data rather than speculation. Here is what the newest edition says is growing fastest through 2035, what is actually driving it, and how to use a projection without mistaking it for a promise.
The ResumeVera editorial team
Resume and hiring research, reviewed against current employer guidance.
Updated 2026-10-05T03:49:56.260Z
11 min

Section 01
What this forecast actually is
Every two years, the Bureau of Labor Statistics publishes a full set of employment projections for the US economy, built around something called the National Employment Matrix. It is a different instrument than the monthly jobs report or the Job Openings and Labor Turnover Survey, which track where the labor market stands right now. This one looks a decade out, using a macroeconomic model of labor force growth, productivity, and final demand by industry to estimate how many people will work in each of roughly 830 occupations in 2035.
The newest edition, covering 2025 to 2035, was released on August 27, 2026. It replaces the 2024-2034 projections published the year before, and it will itself be replaced in two more years, once newer baseline data is available. Treat it the way you would treat any serious long-range forecast: a structured, data-driven estimate of where current trends point, not a guarantee of what will actually happen to any single job, company, or person.
Section 02
The headline number, and the story underneath it
The topline figure is that the BLS expects the US economy to add 5.9 million jobs over the decade, growing total employment from about 170.3 million to 176.2 million, a 3.5 percent increase. That is a noticeably slower pace than the prior decade measured, which saw 10.9 percent growth from 2015 to 2025, though that comparison is skewed by the fact that the earlier period included the recovery from a sharp pandemic-era job loss. A slower growth rate from a larger, more fully recovered base is a different thing than a labor market losing momentum, and the BLS data on its own cannot tell you which story is closer to true.
What the data does make clear is where that growth concentrates. Two related healthcare groups, healthcare support occupations and healthcare practitioners and technical occupations, are projected to account for almost one-third of all new jobs created through 2035. The private healthcare and social assistance sector alone is expected to add more than 2.2 million jobs, about 37 percent of all new employment economy-wide. No other sector comes close to that share. A fifth category worth flagging separately: computer and mathematical occupations, projected to grow 7.3 percent as a broad group, driven largely by continued investment in AI infrastructure and digital tooling across industries that are not themselves technology companies.
It is worth being precise about two different rankings that get blurred together in casual conversation. "Fastest growing" means the occupations below, ranked by percentage change, which naturally favors occupations that start small: a 41 percent jump for nurse practitioners looks dramatic partly because the occupation had roughly 336,000 workers to begin with. "Most new jobs" is a separate ranking of absolute numbers, and it looks different, with registered nurses, software developers, and home health and personal care aides all adding more total positions than several occupations on the percentage list despite growing at a lower rate. Both rankings are honest. They just answer different questions.
Section 03
The ten fastest-growing occupations, 2025 to 2035
Here is the percentage-growth ranking in full, each figure drawn from the same August 2026 release. The wage figures are the BLS projections program's own median annual wage estimates, which are themselves built from the separate Occupational Employment and Wage Statistics survey.
| Occupation | 2025 employment | 2035 employment | Change | Median annual wage |
|---|---|---|---|---|
| Nurse practitioners | 336,300 | 474,100 | +41.0% | $132,300 |
| Solar photovoltaic installers | 31,100 | 42,400 | +36.5% | $53,140 |
| Data scientists | 275,600 | 371,000 | +34.6% | $120,230 |
| Wind turbine service technicians | 11,800 | 15,300 | +29.5% | $64,120 |
| Medical and health services managers | 640,400 | 795,500 | +24.2% | $123,860 |
| Physical therapist assistants | 114,100 | 140,400 | +23.0% | $68,380 |
| Psychiatric technicians | 161,500 | 197,500 | +22.3% | $45,130 |
| Computer and information research scientists | 38,600 | 47,000 | +21.8% | $140,300 |
| Occupational therapy assistants | 52,200 | 63,400 | +21.5% | $72,300 |
| Information security analysts | 192,900 | 233,400 | +21.0% | $129,180 |
Two patterns stand out immediately. Healthcare occupations take six of the ten spots, spanning everything from highly credentialed roles like nurse practitioners to support roles like psychiatric technicians. Technology and data occupations take three spots, each tied in some way to the infrastructure behind AI and digital systems rather than to building consumer apps directly. The remaining two, solar installers and wind turbine technicians, reflect the continued build-out of renewable generating capacity, a trend that has held steady across the last several editions of this same survey.
Section 04
Why these specific jobs are growing
Healthcare's growth is structural, not cyclical. It is driven by an aging population that needs more care, a long-running expansion of the scope of practice laws that let nurse practitioners treat patients with less physician oversight in a growing number of states, and the sheer administrative complexity of running modern healthcare organizations, which is what pushes medical and health services manager demand up alongside clinical roles.
Tech and data roles are being pulled up by AI adoption, but not the way headlines usually describe it. The demand captured here is not mainly for people building chatbots. It is demand for the people who build, secure, and maintain the data and security infrastructure AI systems run on: data scientists who build and validate models, computer and information research scientists who push the underlying methods forward, and information security analysts who have to secure a dramatically larger attack surface as more systems become AI-connected. The broader computer and mathematical occupation group's 7.3 percent projected growth sits well above the 3.5 percent economy-wide average, which is consistent with that read.
Renewable energy growth reflects continued capacity build-out, not a policy bet. Solar and wind installation and maintenance roles have shown up in the fastest-growing rankings for several consecutive BLS projection cycles now, tracking the physical expansion of generating capacity rather than any single piece of legislation.
Section 05
If you want to target one of these roles, check the pay and the resume evidence first
A growth projection tells you where demand is heading. It does not tell you whether a specific role pays what you need, or whether your resume currently makes the case for it. Both of those are checkable before you spend months retraining toward a new target.
Take data scientist, third on the list above at 34.6 percent projected growth and a $120,230 median. That median is a national number, and pay for the same title can differ by tens of thousands of dollars between metros. The BLS wage percentile breakdown for data scientists shows the 10th through 90th percentile range plus the largest US metros, so you can see where a real offer would sit before you commit to the pivot. Once the pay checks out, these data scientist resume examples show what hiring managers in that field actually look for in a bullet point, which is model impact and measurable outcomes, not a list of libraries.
Information security analysts, tenth on the list at 21.0 percent growth and a $129,180 median, map closely to what this site tracks as the cybersecurity analyst occupation. The same two-step check applies: cybersecurity analyst pay by percentile and metro, then cybersecurity analyst resume examples for how to present SOC, SIEM, and incident-response experience in a way that reads as evidence rather than a list of acronyms.
Medical and health services managers, fifth on the list at 24.2 percent growth and a $123,860 median, is the occupation behind most healthcare administrator job titles. Check healthcare administrator pay data first, since this is one of the widest-ranging titles on the list in terms of actual responsibility and pay band, then look at healthcare administrator resume examples to see how that range of responsibility actually gets written up.
If none of these ten occupations are a fit but you still want to benchmark where you stand in your current role, our separate guide on reading BLS salary percentiles walks through the same method for any of the roughly 830 occupations the government tracks.
Section 06
What this list does not tell you
Honesty about the limits of this kind of data matters as much as the numbers themselves. A BLS employment projection is a structural model, built from 2025 baseline data and extended forward using historical relationships between industries, demand, and the labor force. It is not a short-term forecast, it will not flag a single company's layoffs, and it cannot fully price in a sudden shift in policy or technology that has not shown up in the data yet.
That last point matters most for the three technology occupations on this list. The BLS model extends historical and current adoption trends in AI and digital infrastructure forward. It does not, and cannot, specifically model how fast AI tools might eventually automate parts of the very roles that currently build and secure them. Economists and researchers genuinely disagree about the pace and shape of that effect, and this projection should be read as one input into that question, not the final word on it.
A fast-growing occupation also is not a promise of a job for you personally. Growth at the occupation level says demand is rising in aggregate. It says nothing about competition for a specific opening, regional differences in hiring, or whether your particular background matches what employers in that field are actually screening for.
Section 07
Sources
Every figure above traces back to the same federal release.
- U.S. Bureau of Labor Statistics, Employment Projections 2025-2035, news release, published August 27, 2026. bls.gov
- U.S. Bureau of Labor Statistics, Fastest growing occupations table, National Employment Matrix, 2025-2035. bls.gov
These projections are updated every two years. We will revisit this guide when the 2026-2036 edition is released.
Pro tips
Do these
Check the pay for your target occupation and metro before you commit time to a career pivot, since national medians can be tens of thousands of dollars off from what a specific metro actually pays.
Remember that fastest-growing by percentage and most new jobs by raw count are two different rankings; a large, slower-growing occupation can still add more total positions than a small, fast-growing one.
Treat this as a structural, decade-long signal rather than a short-term hiring forecast for any specific company or posting.
Revisit this list every two years when the BLS publishes a new edition, rather than treating any single release as permanent.
Avoid these
Delete these
Reading a high percentage-growth rate as a guarantee of an easy job search in that field right now.
Comparing a national median wage to a specific job offer without checking the metro-level figure first.
Assuming the technology occupations on this list are immune to the same AI-driven change reshaping the roles around them.
Pivoting toward a fast-growing occupation without checking whether your resume currently shows any evidence relevant to it.
Put this into a resume
Building and editing are free, and free PDFs carry a small watermark.
Try the job matcherQuestions
Frequently asked questions
How this guide is maintained
We review this guide every quarter and after any change to the hiring rules or portal behaviour it describes. It was last reviewed on 2026-10-05T03:49:56.260Z. Figures come from named sources, shown beside the number. Where we are estimating rather than measuring, we say so.
By the numbers
41%
Projected employment growth for nurse practitioners between 2025 and 2035, the fastest of any occupation in the new BLS projections
BLS Employment Projections, 2025-2035, released August 27, 2026
5.9M
New jobs the BLS expects the whole US economy to add over the same ten years, 3.5% total growth
BLS Employment Projections, 2025-2035
37%
Share of all new jobs economy-wide expected to come from healthcare and social assistance alone
BLS Employment Projections, 2025-2035
525,500
Combined new jobs across just the ten fastest-growing occupations on this list
ResumeVera calculation from BLS Employment Projections, 2025-2035
Try it
Check the guide against your own file
Everything above is general. Your resume is not. Paste it in and the checker tells you which of these points your file actually breaks.
Check your resume free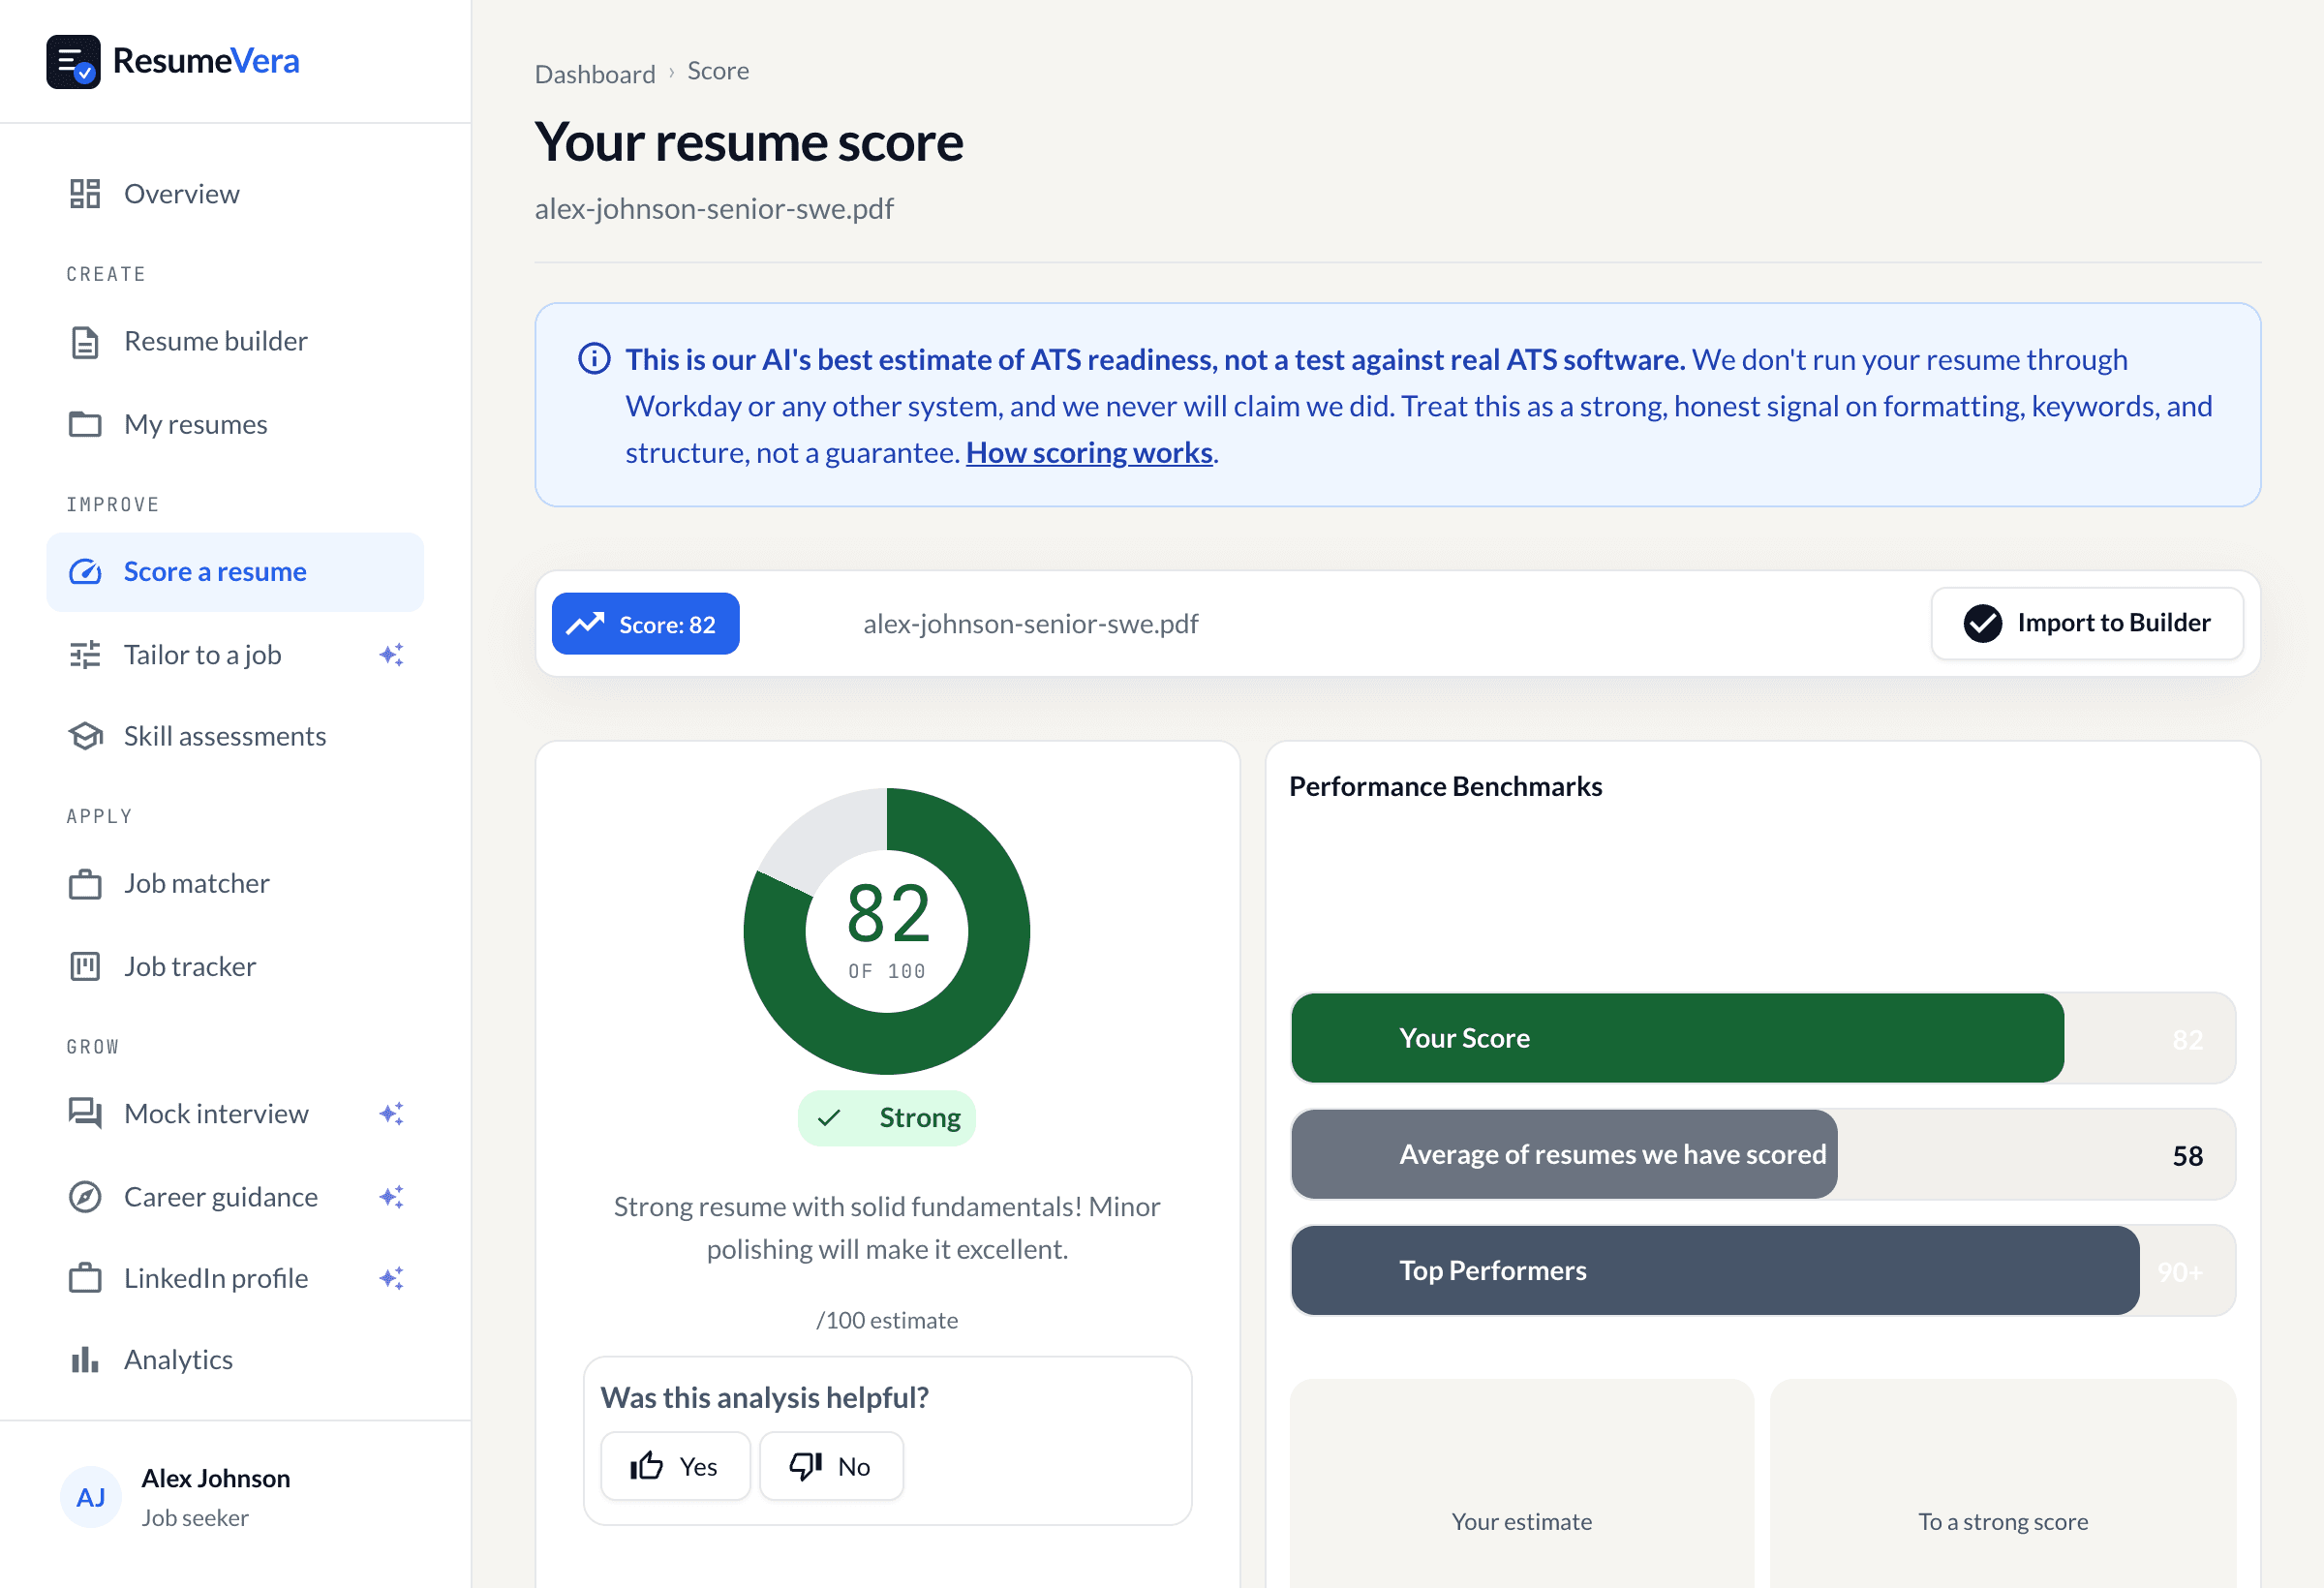
The real score page, with a sample resume and sample scores.
Is your resume ATS ready?
Run a free ATS score check and get specific improvements in seconds.